Get started with Serverless Jenkins X
A crash course in Jenkins X and how to test it out on a local Kubernetes cluster
In this post, I’ll take a closer look at the version of Jenkins X using Tekton, to give you an idea of how the general development, build, test, deploy flow looks like with Jenkins X. How does it feel to ship your code to production using a product coming from the Jenkins community that has very little Jenkins in it?
Expected time to run through all the steps in this walkthrough: 60-90 minutes. Reading time: 15 minutes.
Jump to the different sections of this blog:
- About Jenkins X and Tekton
- Tools you’ll need
- Get Jenkins X up-and-running
- Create a new application
- Create a tunnel and update webhooks
- Understand the setup so far
- Implement a small feature and deploy it
- A few closing thoughts
About Jenkins X and Tekton
The Jenkins X project has been around for almost 2 years now and about a month after its first birthday the team launched the new Jenkins X Pipeline Engine running on top of Tekton.
Jenkins X is basically Jenkins’ cooler cousin, a long-awaited Cloud Native alternative coming from the Jenkins community. It is very opinionated and heavily inspired by the practices described in the Accelerate book, DevOps practices that have been proven to increase the performance of software organizations in a sustainable way.
Depending on the version you select when you install it on top of a Kubernetes cluster, you might use the version that includes a static Jenkins master or the new serverless Jenkins X Pipelines that uses Tekton instead of “Jenkins as the underlying CI/CD engine to provide a modern highly available cloud native architecture”
Essentially, Tekton is a set of Kubernetes Custom Resources Definitions (CRDs) that are used for declaring CI/CD-style pipelines in Kubernetes. You can learn more about these from their official documentation, although this knowledge is not a prerequisite to being able to follow through this post.
Tools you’ll need
Get Jenkins X up-and-running
Note: The default setup of Jenkins X that we will follow in this post requires a GitHub account. It will be used to create a few repositories (one for each environment plus the development project) and setup hooks from them towards the Tekton resources running in the local Kubernetes cluster.
The first step is to get Jenkins X CLI installed on your local machine. Depending on what OS you are running, there are several options for how to do this. Since I am running macOS and I have brew installed, I will go ahead and do that with brew:
brew tap jenkins-x/jx brew install jxNow that jx is installed, let’s install Jenkins X in a Kubernetes cluster. If you don’t have a Kubernetes cluster just lying around unused, keep calm and use Minikube, a simple alternative which runs a one-node Kubernetes cluster on your computer. Thankfully, Jenkins X comes with a special command to install Jenkins X in Minikube and it will even install Minikube and all its dependencies, if you don’t already have it.
At the time of writing, Kubernetes 1.16 just came out and it seems that the Deployment resources used by Jenkins X use the unsupported extensions/v1beta1 API group. Therefore, I recommend being explicit about what Kubernetes version to install until this issue is fixed:
jx create cluster minikube --kubernetes-version=v1.15.4I’d also recommend using the following settings, instead of the default ones, when asked by jx for memory, cpu and disk-size to make sure there are enough resources to run everything:
? memory (MB) 8192
? cpu (cores) 6
? disk-size (MB) 150GB
? Select driver: hyperkit
Make sure to select Serverless Jenkins X Pipelines with Tekton when asked to select a Jenkins installation type. Further on, you will be required to set up an API token in your GitHub account and provide it in the install. The installation process can take a bit of time, as there are a lot of Docker images to be downloaded, so I recommend running this install when connected to a fast Internet connection.
Note: If you went with hyperkit and you are connected to a VPN when running the command above, it will most likely fail because of a resurfacing bug with Minikube. Once you disconnect from the VPN and try again (delete Minikube cluster, .minikube and .jx) everything should run just fine. —
If you see an output like the one below, you know the setup has completed successfully and that you have Jenkins X up and running in your local cluster:
Jenkins X installation completed successfully


	********************************************************

	     NOTE: Your admin password is: q0DVn0ylXXEn_MVH5x3-

	********************************************************


Your Kubernetes context is now set to the namespace: jx
To switch back to your original namespace use: jx namespace default
Or to use this context/namespace in just one terminal use: jx shell
For help on switching contexts see: https://jenkins-x.io/developing/kube-context/
To import existing projects into Jenkins:       jx import
To create a new Spring Boot microservice:       jx create spring -d web -d actuator
To create a new microservice from a quickstart: jx create quickstart
Context "minikube" modified.
NAME              HOSTS                                    ADDRESS        PORTS   AGE
chartmuseum       chartmuseum.jx.192.168.64.8.nip.io       192.168.64.8   80      92s
deck              deck.jx.192.168.64.8.nip.io              192.168.64.8   80      92s
docker-registry   docker-registry.jx.192.168.64.8.nip.io   192.168.64.8   80      91s
hook              hook.jx.192.168.64.8.nip.io              192.168.64.8   80      92s
nexus             nexus.jx.192.168.64.8.nip.io             192.168.64.8   80      91s
tide              tide.jx.192.168.64.8.nip.io              192.168.64.8   80      92s
Notice the hosts at the bottom. These are some magic URLs using the awesome service nip.io, which basically resolves any DNS queries of that format to the IP that is in the URL. We’ll refer further to these records as the cluster Ingresses. In my case, 192.168.64.8 is the local IP of the Minikube cluster and all those DNS records are configured as Ingress rules which point to each of the services running in my local Minikube cluster.
Note: In some cases, the nip.io service might be unreachable from your network and therefore the domain names in the cluster Ingresses will not work. One cause for these records to not be resolved locally is if your router has enabled DNS Rebinding checks, which will basically discard any DNS responses that return private IPs. Take the time to go to the deck URL from your installation, in my case http://deck.jx.192.168.64.8.nip.io. If you are not presented with a basic login dialog, then either nip.io does not work for you or there is something wrong with your deck pod. If your pod is healthy, then I suggest you either look into your router settings and search for DNS rebinding checks settings or add a record in /etc/hosts for all the hosts from your cluster Ingresses. If you go for the /etc/hosts option, be aware that there will be more hosts to add as we go.
If you list the namespaces that have been created, you will most likely see a list like this:
$ k get ns
NAME STATUS AGE
default Active 26m
jx Active 24m
jx-production Active 18m
jx-staging Active 18m
kube-node-lease Active 26m
kube-public Active 26m
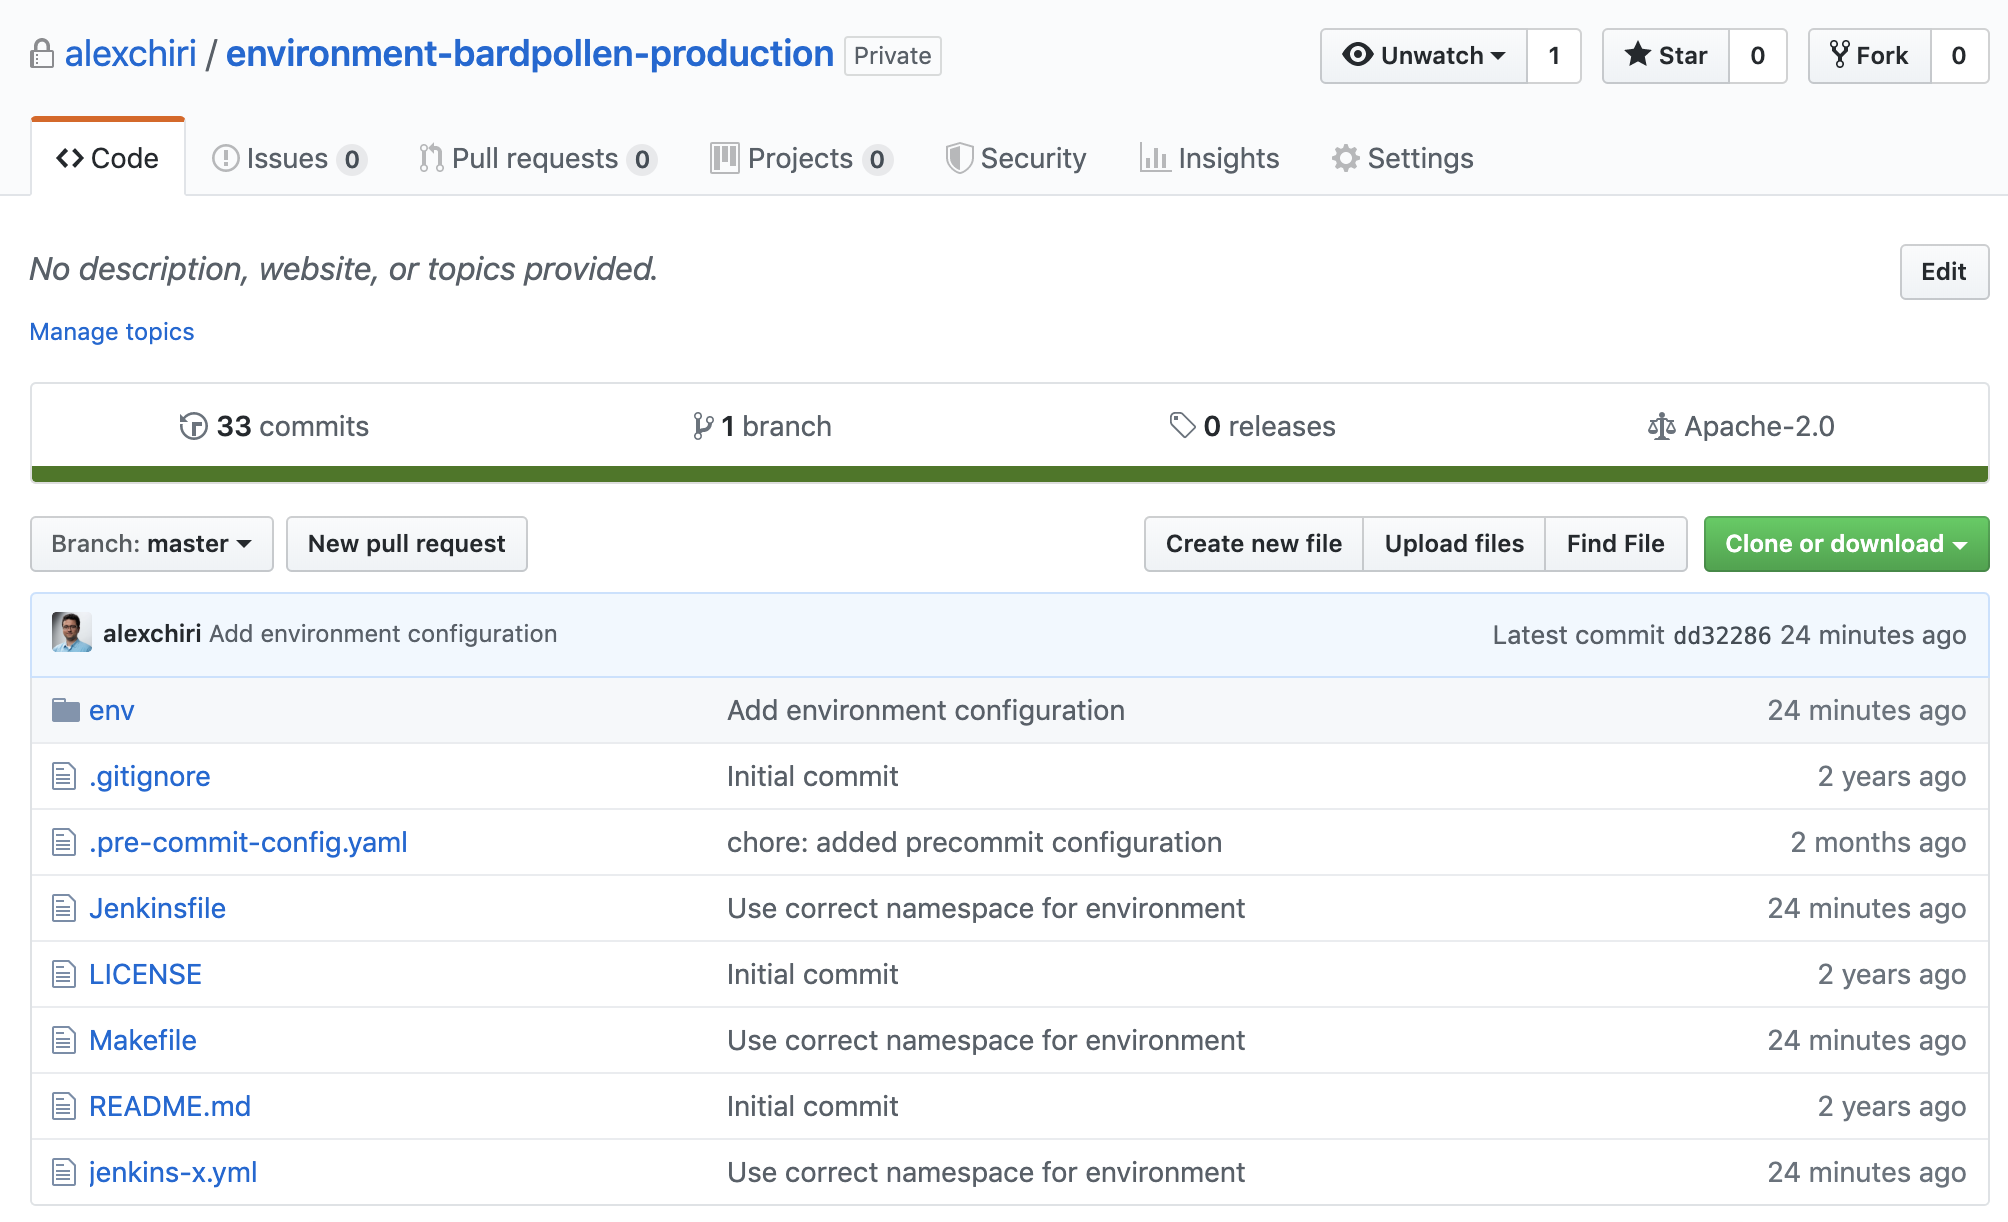
kube-system Active 26mjx-production and jx-staging namespaces correspond to the production and respectively the staging environments Jenkins X creates by default. A set of private repos that correspond to these environments were also created in your GitHub account during the installation process:
I’ll talk more about these environments and the repos a bit later, now let’s create a project to develop!
Create a new application
Jenkins X offers a wide range of application templates to get you easily started. Nevertheless, if you feel there are some missing, you can contribute your own through a PR. I went for the react-quickstart one for the purpose of this walkthrough. You can do the same using the following command:
jx create quickstart -f react-quickstartI decided to name the project react-quickstart-jenkinsx and tell jx to create a repo in my configured GitHub account. At this point, the initial pipeline has been triggered for you. I suggest you take a bit of time and run the jx get activity -f <repo_name> -w, where repo_name is the name of the repo you have given to the jx create quickstart command.
You will see all the steps that are running in the current pipeline and get an idea of what Jenkins X has set up for you automatically. But don’t let your attention be caught too long with this. Since we are running the cluster locally, we need to fix a few things before the pipeline can complete.
Create a tunnel and update webhooks
You probably noticed the Creating GitHub webhook in the console output and you were probably quick to notice that the URL for the hook is one that resolves to a private IP. And that is not accessible from GitHub, which means the webhooks on your repositories don’t work at this point. Let’s fix that!
One easy way to do that is using ngrok.io. So go ahead and create an account on their website, it’s free. Next step is setting it up:
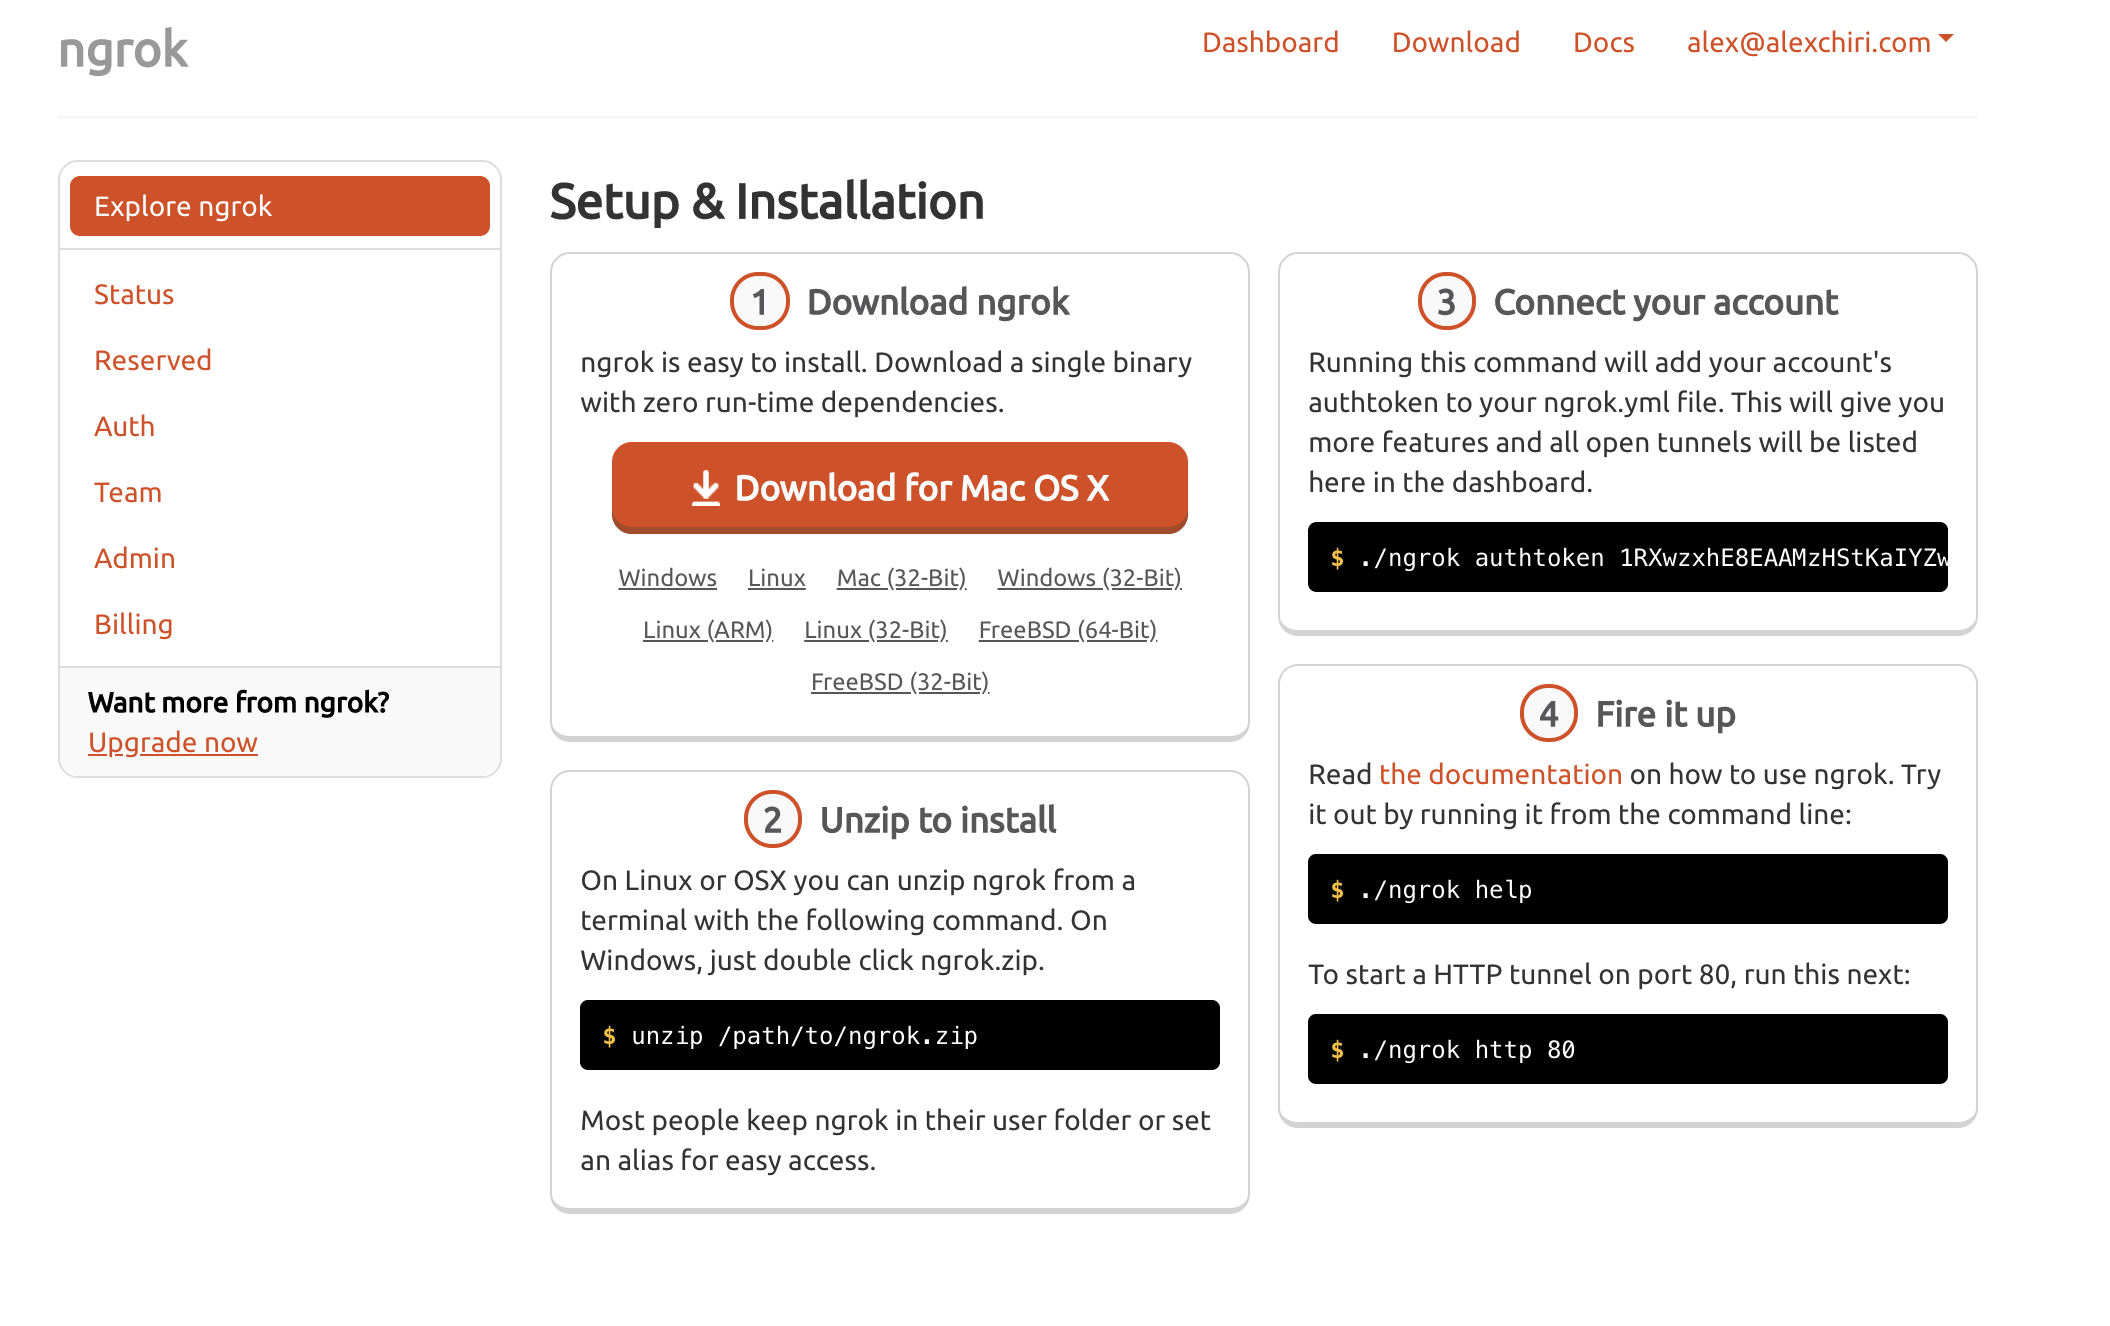
Follow steps from 1 to 3 and once you’re there, you’re good to go.
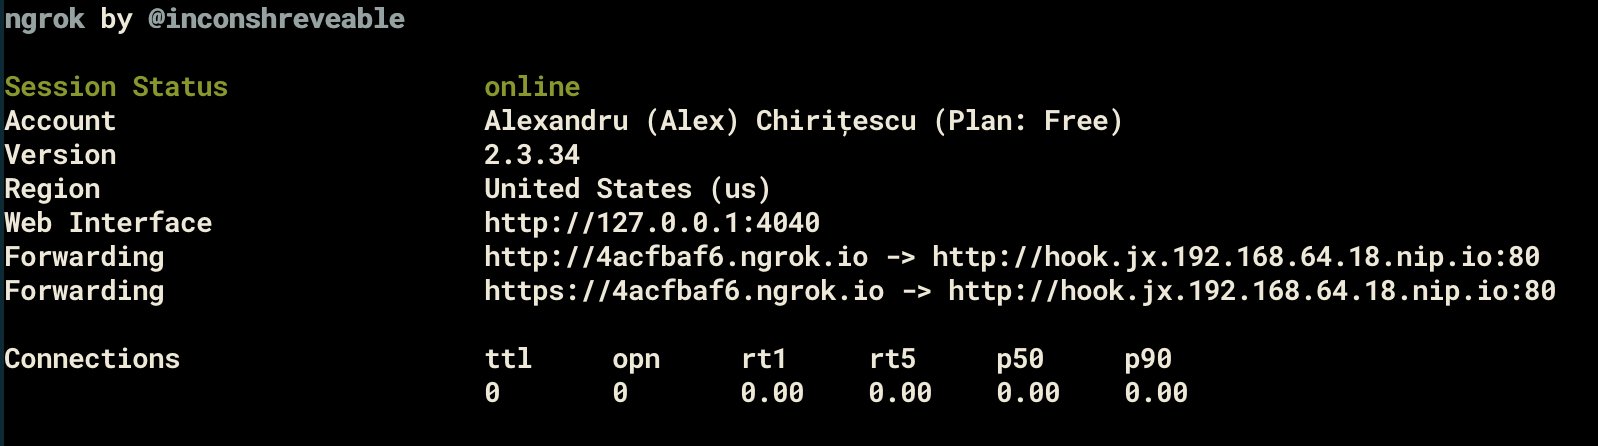
What we want to do here is open a tunnel from our local computer to an external URL, but not in any way, we would like ngrok to also do a host rewrite, because the Ingress rules in our cluster rely on that to distinguish between the different services we want to access. We can do all this with the following command, where <hook_host> is the hook host from the cluster Ingresses:
ngrok http -host-header=rewrite <hook_host>:80Next thing you should see is an output similar to the one below, now that the tunnel is ready. Notice the Forwarding records:
With the external URL up and running, now it’s time to update the webhooks in the GitHub repos. In order to do that, you need to go to the Settings -> Webhooks page of each repo: the staging one, the production one and the one created for the project itself. We need to edit the existing webhook for each of the repos and update the Payload URL field to use the ngrok.io URL instead of the nip.io one. Take the example of my production repo:
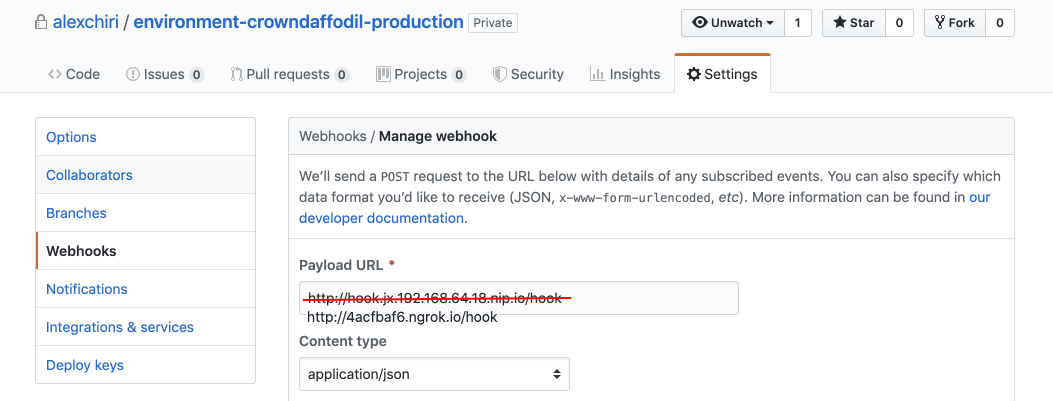
Click Update webhook at the bottom of the page and once it’s saved, expand the latest record in the Recent Deliveries section by clicking on it and then trigger Redeliver. If everything went well, there should be a green tick next to the delivery you just redelivered. Now make sure that all 3 repos have the updated webhook and that the latest delivery is green.
Understand the setup so far
After we’ve updated and redelivered all webhooks, several pipelines should’ve started to run and if all goes well, the output of jx get activities would show you all the pipelines and their steps that have run so far.
You can visualise the same pipelines through the Prow dashboard accessible at the deck URL shown in the cluster Ingresses (for me it’s http://deck.jx.192.168.64.18.nip.io/). You might get asked for a username and password: use admin as the user and the password is the one shown in the console output of the jx create cluster command.
These are all the pipelines that have run so far: one for the master branch of our project, one for the first PR of the staging repository and one for the master branch of the same repo. I’m sure that at this point you are wondering how did all these pipelines appear and what or who created them. I will try to explain that below. The following diagrams show a very simplified view of what happens, the focus is on the changes that happen to the repositories and the environment namespaces in the cluster.
Created a cluster with Jenkins X installed on it
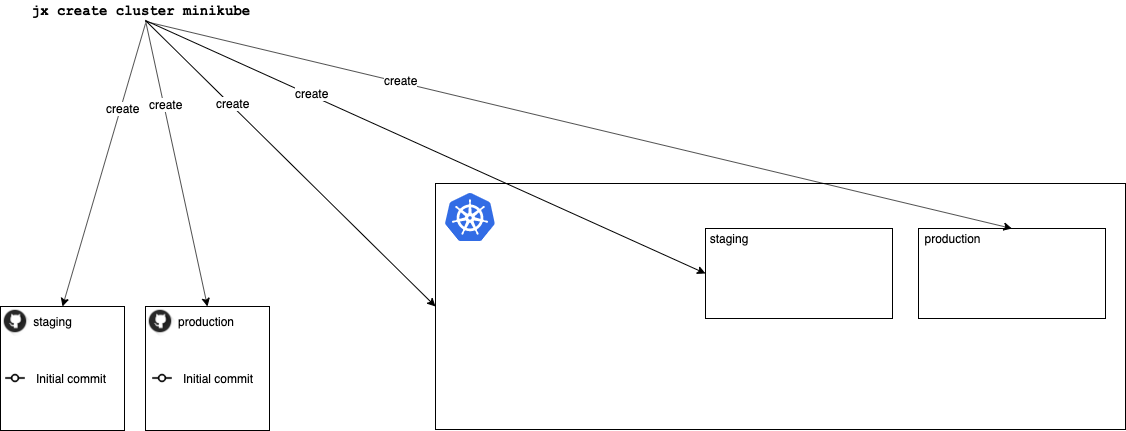
When we create a new cluster with Jenkins X, the CLI will create all the needed resources. Among those, the CLI will create a new local cluster with Minikube, with several namespaces in it including one for the staging environment and one for the production environment. At this stage they are both empty. There are other namespaces created that aren’t shown here, including the jx namespace that includes all the needed tools to have Jenkins X and pipelines running in the cluster.
The jx create cluster also creates two new repositories in GitHub: one for the staging environment and one for production. The names of the repositories are generated in the following format environment-$prefix-$environmentName. The $prefix is normally randomly generated, but you can specify it with --default-environment-prefix argument to the jx create cluster command.
No pipelines have run so far, all the setup was done by the CLI.
Created a new application using a provided quickstart
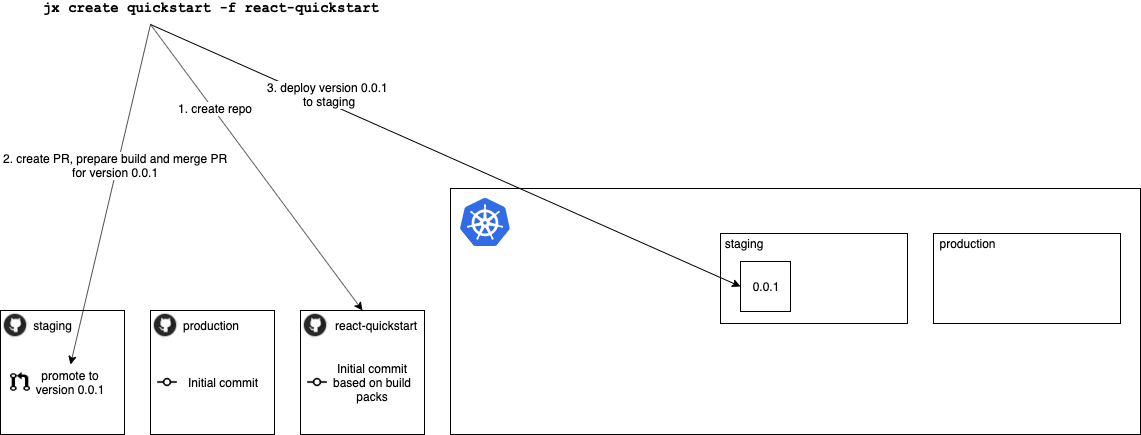
In the next step, I have created a new application to develop using Jenkins X and I used one of their quickstart templates for creating a new ReactJS application. This is also done through the Jenkins X CLI.
-
A new repository is created locally and it is pushed to the configured GitHub account. The content of the repository is based on the quickstart template files (each quickstart is a repository in this project) and the build pack matching the technologies used in the project. The build pack selected for this project is the
javascriptone and it copies some of its files (like Dockerfile) into the project to create the first commit. The Dockerfile is used to run the application in all the environments. -
With the initial commit to the application repo a first pipeline is started that builds the app and creates a Dockerfile for this version of the app. Since all the commits to the
masterbranch of the application repository are automatically promoted to staging by default, it also creates a new branch and PR in the staging repository for deploying the version 0.0.1 to staging. Then this first pipelines hangs here until the promotion builds happen or when it times out, whatever happens first. -
The new promote PR in the staging repo triggers another pipeline that prepares the Helm chart for the deployment to staging and publishes it to the
chart-museumin the cluster. Once this is done, this second pipeline merges the PR to themasterbranch of the staging repository. This unlocks the first pipeline and triggers another build to deploy the application to staging.
At the end of this step, the application is running in the staging environment. We can easily discover its URL using the jx get applications command.
Implement a small feature and deploy it
Now that it’s a bit clearer how this works, let’s try to use this for implementing some features in our react app and see how we can use Jenkins X to deliver those features to production.
I will make a small change in the main component of our project and add a new line of text in the page: Added a tiny, but important change to our project.
I will then create a new branch called new-feature and push it to the remote. Next, I will create a PR from that branch to master and wait for a new pipeline to start. To see the progress of this pipeline and the steps included, I will run the following command:
jx get activities -f react-quickstart-jenkinsx/PR-1 -wAs you may have guessed, each push to a branch that has a pull request triggers a new pipeline and the pipeline name has the following format: <repo-owner>/<repo-name>/PR-<pull-request-number>
If your pipeline finishes successfully, the output should look like this:
alexchiri/react-quickstart-jenkinsx/PR-1 #1 2m51s 2m41s Succeeded
meta pipeline 2m51s 20s Succeeded
Credential Initializer 5ftfw 2m51s 0s Succeeded
Working Dir Initializer 8v64t 2m51s 1s Succeeded
Place Tools 2m50s 1s Succeeded
Git Source Meta Alexchiri React Quickstart Ch8zz 2m49s 6s Succeeded https://github.com/alexchiri/react-quickstart-jenkinsx.git
Git Merge 2m43s 3s Succeeded
Merge Pull Refs 2m40s 2s Succeeded
Create Effective Pipeline 2m38s 5s Succeeded
Create Tekton Crds 2m33s 2s Succeeded
from build pack 2m28s 2m18s Succeeded
Credential Initializer Tsg4g 2m28s 0s Succeeded
Working Dir Initializer N72vt 2m28s 1s Succeeded
Place Tools 2m27s 1s Succeeded
Git Source Alexchiri React Quickstart Jenk Ndg74 2m26s 7s Succeeded https://github.com/alexchiri/react-quickstart-jenkinsx.git
Git Merge 2m19s 3s Succeeded
Build Npmrc 2m16s 2s Succeeded
Build Npm Install 2m14s 38s Succeeded
Build Npm Test 1m36s 4s Succeeded
Build Container Build 1m32s 24s Succeeded
Postbuild Post Build 1m8s 1s Succeeded
Promote Make Preview 1m7s 18s Succeeded
Promote Jx Preview 49s 39s Succeeded
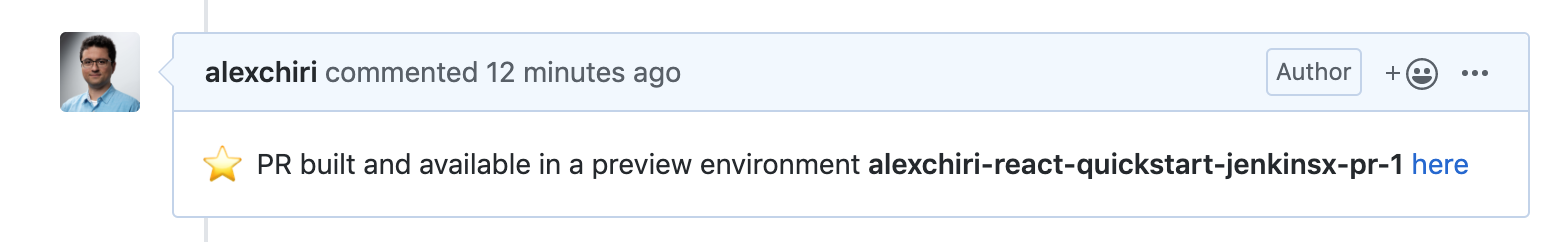
Preview 31s https://github.com/alexchiri/react-quickstart-jenkinsx/pull/1
Preview Application 31s http://react-quickstart-jenkinsx.jx-alexchiri-react-quickstart-jenkinsx-pr-1.192.168.64.18.nip.ioNotice the last step of the pipeline: we even got ourselves a Preview environment created to try out the changes on a temporary environment. Not only that, but I also got a comment on my PR (done by a Jenkins X bot using my credentials) with the URL to the preview environment:
(screenshot)
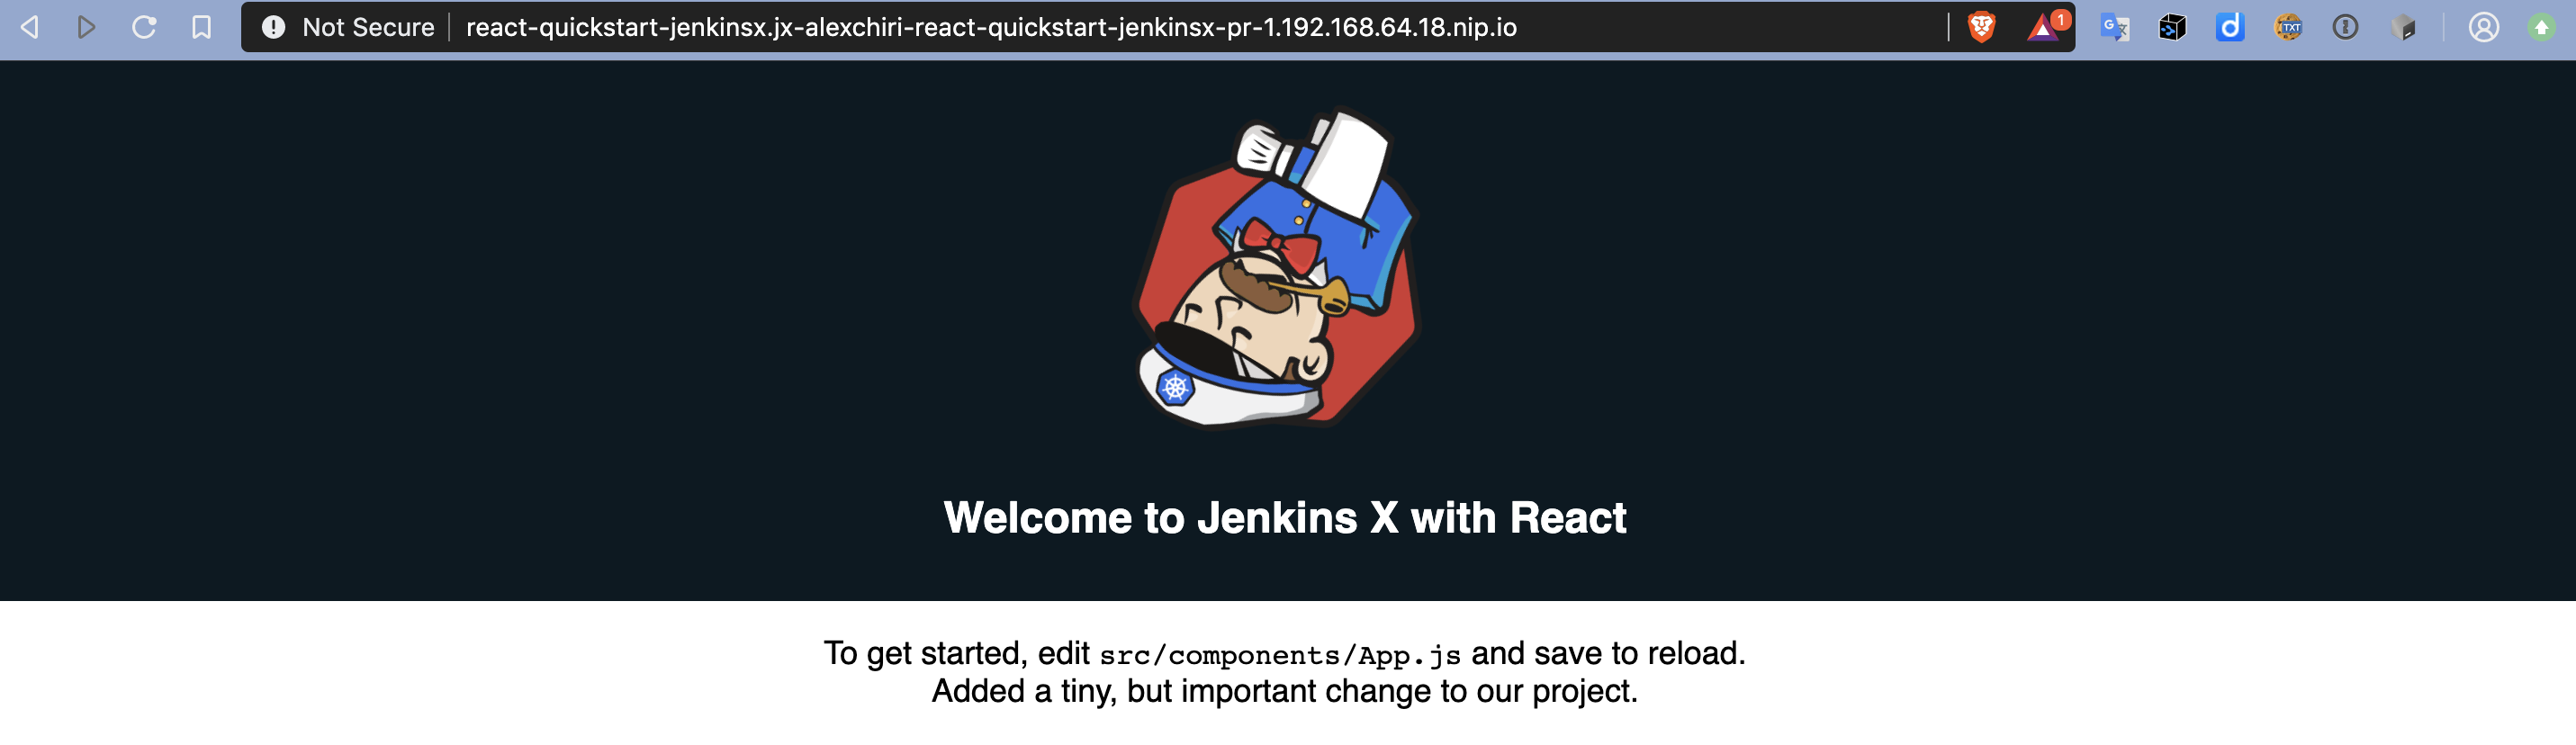
Sure thing, if we follow the URL, we get to see the feature we implemented in action:
I like how the implementation looks, so the next step is to merge the pull request and promote this feature to staging. In order to do that, I need to merge the pull request and let the pipelines take care of the rest.
Note: The intended way to merge the pull request is by approving the pull request in GitHub (using commands recognized by the bot like /lgtm) and letting the pipelines merge it. But in order to do that I would need to have another GitHub user to add as a reviewer and approve the pull request using that user. Since it is assumed that normally a team would work on a project, then there would be several users that own it and review pull requests. To configure these users, simply edit the OWNERS file in the project repository.
Shortly after the merge, a new pipeline starts that releases the changes to the staging environment, in the same way version 0.0.1 was released initially to staging, when the initial commit to the react-quickstart-jenkinsx repository was done.
At this stage, if you look at what previews we still have running (you can do that using jx get previews), you will notice that the preview environment which was created for our first pull request is still up and running, although our PR has been merged. You can either let the Jenkins X cron job delete it (which runs every 3 hours) or manually delete them using the CLI:
jx delete previewSo we have implemented a new feature in our project, we tested it a bit in a preview environment and we further promoted it to the staging environment. Let’s say we did further tests in staging and we are satisfied with the results. How do we promote it to production?
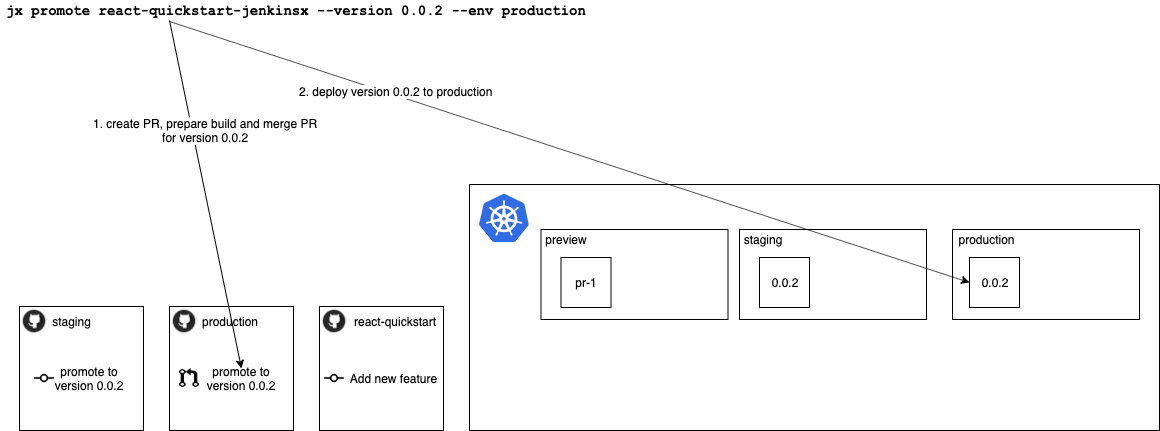
We simply use the promote command:
jx promote react-quickstart-jenkinsx --version 0.0.2 --env productionAs you surely guessed, this triggered two new builds, one to create a pull request in the production repo with the new version and another one to merge it and deploy it to the production environment. Once that is done, we can access our application with the new feature using the production URL. You can visualise what applications you are managing and their respective URLs for each environment at any time by running jx get applications and the output will be something similar to this:
APPLICATION               STAGING PODS URL                                                              PRODUCTION PODS URL
react-quickstart-jenkinsx 0.0.2   1/1  http://react-quickstart-jenkinsx.jx-staging.192.168.64.18.nip.io 0.0.2      1/1  http://react-quickstart-jenkinsx.jx-production.192.168.64.18.nip.io
Use the Production URL and you will see the same changes deployed, once the pipeline finishes. Below there is a simplified representation of what happened during the promotion to production:
Note: If you would like to clean up your environment and remove Jenkins X from the Minikube cluster, you can use the command jx uninstall and follow the instructions shown by the CLI. It will be uninstalled from the cluster in no time!
A few closing thoughts
This walkthrough is barely scratching the surface. There are many great add-ons (like Prometheus, for monitoring or KNative and Gloo, for better application and resource management) and features (like Dev Pods) that we have not talked about.
I’m sure there are even more coming and we will hear much more about these and Jenkins X in the following years.
At this point, Jenkins X still feels like it’s at an early stage. It’s being heavily developed and the documentation could use considerable improvements, especially for users who are not using the default configuration and settings.
That being said, it promises to become a very powerful tool that enables healthy habits and ways of working in teams. It does so in a timely manner and uses best practices in CI/CD while it’s at it.
Published:
Updated: