The basics of human-centered design: user testing demystified

Great user experience (UX) is born from human-centered design (HCD) – careful, iterative design that considers and involves users at every point. The ISO standard defines HCD as:
“An approach to interactive systems development that aims to make systems usable and useful by focusing on the users, their needs and requirements, and by applying human factors/ergonomics, and usability knowledge and techniques.”
Successfully employing HCD requires a shift in perspective. Rather than starting from your organization's business and technological goals, you start from your users and their unique perspective.
By creating real value for your users by meeting their needs, you also bring value to your company. After all, who would not be willing to pay for something that brings them real value? It’s a win-win.
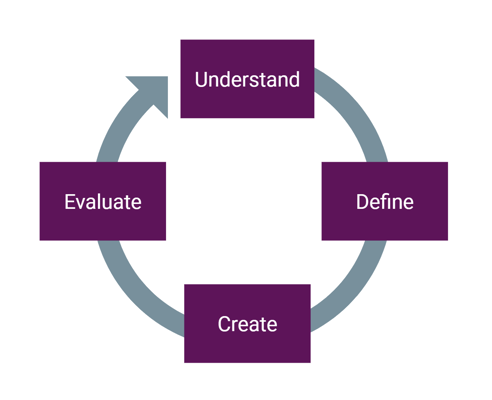
Iteration is essential
A key part of HCD is iteration. The process has four steps:
- understand the context of use
- define your goals
- create solutions
- evaluate the solutions against your goals
With each iteration, you remove barriers and pain points from the user journey and identify new opportunities to delight the user. If you do this right, you eventually end up with something that not only meets, but exceeds expectations. You create a real “wow” effect.
It’s not about having a nice-looking product – it’s about understanding the user’s needs and solving their problems in a way that feels great and intuitive to them.
The human-centered design process (simplified from ISO 9241-210) gives a straightforward model for achieving great UX through constant iteration and user testing.
Testing is the key
A key part of HCD is constant evaluation and testing. There are countless ways to measure UX. Each method falls under one of two categories: qualitative and quantitative methods.
Qualitative UX testing methods
Qualitative methods seek to understand human experiences and behaviors rather than creating predictive models or theories. They have a more diffuse focus than quantitative methods.
Qualitative data is inherently rich, which is a double-edged sword – it enables very in-depth analysis but can be unwieldy to work with. Sample sizes are usually small by design, as you often start to lose focus as the amount of data increases. The data is simply too rich, and tools are limited – most statistical data analysis techniques, for instance, are not suited for this type of data. That said, the insights you gain are often invaluable and hard to obtain otherwise.
You often use qualitative methods to study how users think and why they have trouble using different products and features. Qualitative findings include context, so they are generally more intuitive to understand than quantitative findings (more on that below).
There are a wide variety of qualitative methods, including:
- usability testing
- heuristic evaluation
- Interviews
- qualitative questionnaires
Let’s have a look at each of them in turn:
Usability testing
You observe end users performing realistic tasks in real-time to identify their pain points.
Users are often asked to think aloud while performing tasks to provide additional context. This type of verbal data is more “raw” and honest than interview data, as “think-aloud” is constant. Users don’t get a chance to filter or process their thoughts before expressing them.
Combined with observation, think-aloud data can provide great insight into the user’s way of thinking in a relatively short time span.

A typical usability test involves the user (left) performing different tasks while the moderator (right) observes and records the user’s behaviors and comments.
Heuristic evaluation
Repeated studies across multiple industries have identified general rules of thumb (or heuristics) for usability. These are mostly centered around themes like:
- clarity
- consistency
- flexibility
- efficiency
Famous examples include Nielsen’s 10 Usability Heuristics and Shneiderman’s 8 Golden Rules.
In a heuristic evaluation, usability experts independently evaluate a product against a preselected set of heuristics. Heuristic evaluations are quick and cost-effective, but they require expertise. Also, as no actual users are involved in the process, you will not be able to capture all user pain points this way.
Interviews
Interviews come in many forms. They can be individual or group-based, and they can also be structured, semi-structured, or unstructured.
Structured interviews stick to a predefined set of questions, while unstructured interviews explore a topic without any predetermined structure. For user research, semi-structured interviews strike a good balance, allowing users to express themselves freely while retaining some structure. Questions are generally prepared beforehand, but there is some flexibility to explore related topics, as long as it is relevant.
Interviews give users the opportunity to provide detailed answers about in-depth topics while preserving crucial context. Experts and experienced users make for good interview candidates, as they have special insight built up over time, which can be hard to capture with other methods.
Qualitative questionnaires
Qualitative questionnaires are generally made up of freeform questions. Similar to a structured interview, the user answers predefined questions. The difference is that here it is done in text form. So you lack the human-to-human element, but on the other hand, the data is easier to handle, as no transcription is needed.
Quantitative UX testing methods
Quantitative methods are all about measuring things with numbers. To do this, you have to define your object of study and eliminate other factors. Findings are limited in scope, but also scalable – in a relatively short span of time, a lot of data can be gathered and analyzed using statistical methods.
Quantitative data can be tricky to interpret, often requiring a fair bit of statistical knowledge and expertise to draw accurate conclusions. But when done right, results are accurate, representative, and comparable. Also, quantitative methods allow you to easily compare results and track data over time, which is very useful indeed.
There are a number of different quantitative indicators, including:
- task performance measurements
- analytics
- A/B and multivariate testing
- card sorting
- eye tracking
- quantitative questionnaires
Now let us look at each of these indicators in turn:
Task performance (quantitative usability testing)
Users are asked to perform realistic tasks. But unlike qualitative usability testing, the focus is on performance metrics, such as completion time, error rate, and success rate. Users are generally not asked to think aloud, as this can affect metrics such as completion time.
Analytics
A wide array of tools are used to measure numeric data about your service, including time on site, drop rate, and click rate on different elements.
Analytics is a great tool to track how users en masse really use your service. But it is only as useful as the trackers you have defined. Crucial issues may go unnoticed simply because you are not tracking the right metrics. In one instance, a major e-commerce site was unaware that many users were dropping off at a specific point during the checkout process. While they employed analytics, they had not thought to track this specific issue – so they missed the problem.

Analytics is a great tool for collecting large amounts of data on user behaviors.
A/B or multivariate testing
A/B testing is simple – make two versions of a user flow, divide your users in two (A and B), and show one version to group A and the other to group B. Compare the outcomes – which one performed better? Ideally, the two versions should only have one clear difference. Otherwise, you can’t tell why one version performed better.
Multivariate testing is similar but with multiple variables. For example, if you have two versions of a button and two versions of the background, this creates four permutations in total that you need to test. The number of permutations increases exponentially with each added variable (just five variables produce 120 permutations), so this method can sometimes require unrealistically large sample sizes. That said, it is a powerful method for pinpointing problem areas in your user flow.
Card sorting
Card sorting can be used to determine the ideal information hierarchy. Users are given a set of cards and are asked to sort or categorize them in a way that feels most logical to them. This is especially useful for services with a lot of content, as it gives crucial information about how users structure information mentally.
Eye tracking
In eye-tracking studies, users’ eye movements over time are tracked while they perform various tasks. By observing eye movements, you gain insight into how the user scans the user interface and what elements they focus on. While useful in many ways, eye tracking data can be hard to interpret, as it is difficult to tell why a user moved their eyes as they did.
Quantitative questionnaires
Quantitative questionnaires use numeric data (e.g. Likert scale) to collect and quantify responses.
The advantage is that numeric data is easy to compile and allows for statistical analysis. The disadvantage is that a quantitative questionnaire is only as good as its questions/response options. Crucial information may be missed simply because the relevant questions or response options were not defined. This is especially true for response options with multiple interpretations – “every now and then” can mean once a week, once a month, or once a year, depending on the person.
Note that questionnaires often combine quantitative and qualitative questions.
Combining the qualitative and quantitative UX testing methods
To evaluate your UX, you should be using both qualitative and quantitative methods.
Generally, it’s easier to do qualitative research first. If done right, you get a good glimpse of the context of use and pain points of your service. You can then use quantitative methods to investigate how serious and widespread these issues are. Quantitative methods are also great for tracking changes over time, which is essential for improving UX.
If you prefer to start with quantitative methods, you can do that too. For instance, you may notice something is off in the analytics. Maybe your clients are spending far less time on your site than you think they should be. You can then use qualitative methods to explore why this is. Do they dislike the way it looks? Maybe they can’t find what they’re looking for and give up. Or maybe they do find what they’re looking for and leave satisfied? Test and find out.
To sum up: Qualitative and quantitative data are both essential in determining the true state of your UX. By combining the strengths of both, you get the best of both worlds – you understand both what users do and why they do it. This enables you to make the right decisions to elevate your UX and bring both you and your users value.
Published:
Updated: