How to transfer Robot Framework results from Jenkins to Grafana

This tutorial will show you how to move your test results from Robot Framework to your Jenkins Pipeline so that they’re visible in Grafana.
You may have a number of pipelines in your Jenkins (an open source automation server which comes in useful for continuous integration). A few of them may have automated Robot Framework tests.
By linking these tests to Grafana via Jenkins, you gain visibility over your test cases. Instead of needing to check all of them frequently, you can create a monitoring view to track your tests.
Then you can see what happens in your tests and if you see that there is a problem, you can dig deeper and fix it.
What you will need
- Jenkins fits with plugins so that the Jenkins job definition has Robot Framework pipeline step option
- Grafana
- InfluxDB for passing over the data.
Steps
#1 Configure Jenkins so that you can publish the data
-
You need to install the plugins ‘Robot Framework plugin’ and ‘InfluxDB Plugin’ to Jenkins.
Both plugins were created by and are currently maintained by Eficode and are one of the many ways we contribute to the open source community.
-
Go to ‘Manage Jenkins > Configure System > InfluxDB Targets’ and enter the credentials of InfluxDB.
Now, all results of Jenkins and Robot Framework are published to InfluxDB.
#2 Configure the pipeline to publish to InfluxDB
Add a new step to your pipeline after the results of Robot Framework get published
robot outputPath: 'out/’
Remember to adjust the path to the folder your Robot Framework log and report files are located in.
Below is a small full pipeline example with running Robot Framework:
pipeline {
        stages {
               stage(’Test’) {
                       steps {
                               sh ‘robot -d out/ my_test/’
                         }
                 }
         post {
                 always {
                        robot outputPath: ‘out/’
                        influxDbPublisher selectedTarget: ‘myDb’
                  }
           }
   }
#3 Connect Grafana to InfluxDB and create a dashboard
- Install the ‘InfluxDB’ data source.
- Go to ‘Configuration > Data Sources > Influxdb’ and enter the credentials of InfluxDB.
- Select your wanted dashboard or create a new one.
- Press ‘Add panel’ and choose ‘Add Query’.
- As a query you select ‘Influxdb’.
- Enter your data
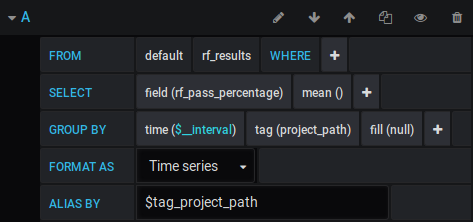
- ‘FROM’: The type of measurement. Here you can find all types.
- ‘SELECT’: Select the field you want.
- ‘GROUP BY’: Group by the`project_path`, so that you get one graph per job. If you want to merge all branch jobs in a multibranch pipeline to one graph, use ‘project_name’.
- ‘ALIAS BY’: Rename the displayed name.
- Now switch to ‘Visualization’ on the left and choose ‘Gauge’.
- You have quite a lot of options to optimize your graph. Just take a look through the options.
Further reading
Hope you found this tutorial helpful. Here’s some further reading to help you along.
Automation is a bread-and-butter practice of DevOps, which helps the software development process become less painful and creative. So remember to have fun with it!
Published:
Updated: